1 · Bring together
The how much and the why of travel
Large-scale measured flows are cross-referenced with what residents say: purposes, habits, barriers to change.
Regional i-Démo award winner, supported by




AI-powered mobility flow prediction
MOBIMIX predicts travel across your territory and tells you which measures will shift the most trips to other modes. Before you invest, not after.
Example in Nice
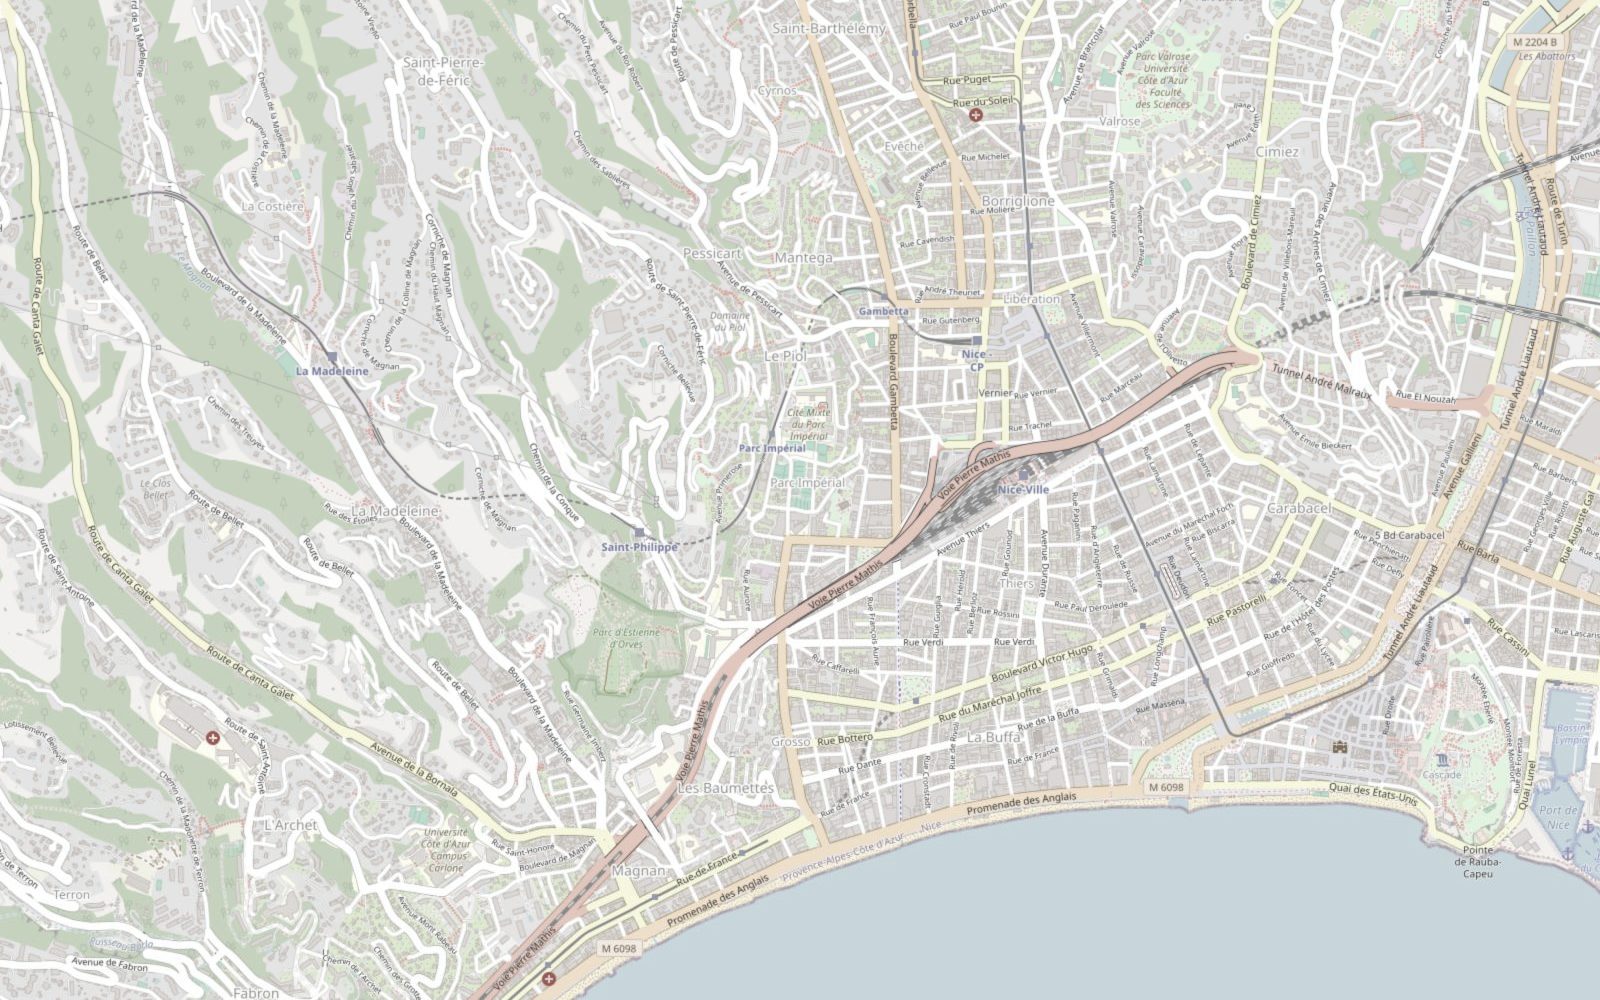
Connecting the Madeleine valley to the seafront: a corridor where the car dominates short trips.
The question every local authority asks
« What should I do to reduce the place of the private car? Where? For whom? In what way? »
Today, traffic counts say how much people travel and surveys say why, but no tool combines the two to predict what will change. MOBIMIX does.
How it works
1 · Bring together
Large-scale measured flows are cross-referenced with what residents say: purposes, habits, barriers to change.
2 · Predict
Models trained on real data simulate the effect of a measure or a new service, with a reliability index.
3 · Recommend
Where to build, which users to target, which service to launch: you know where to start and why.
A concrete example in Nice
Nice wants to grow cycling beyond the seafront. MOBIMIX shows, through four readings of the same map, where a new path will have the most effect.
1 · The finding
Short trips to the centre are made by car. From Madeleine, Saint-Pierre-de-Féric, Cimiez or the port, the car dominates.
2 · Current use
Cycling stays concentrated on the Promenade and the inner centre. The hillside neighbourhoods are almost absent from it.
3 · The potential
Two corridors could shift to cycling: the Madeleine valley and the Pessicart–Gambetta corridor. AI identifies where residents are ready to change.
4 · The recommendation
The route to build first: boulevard de la Madeleine, linked to the Promenade. A clear case to present to elected officials.
Illustrative flows and routes, on a real base map of Nice © OpenStreetMap contributors.
Try it now
Choose a city already analysed, or request yours. Measurements are computed on current OpenStreetMap data.
One diagnosis at a time · 5 new cities per hour · municipalities under 500 km²
Base map © OpenStreetMap contributors. Displaying the map loads their tiles from openstreetmap.org.
And many other decisions
A behavioural question: identifying the trips and the groups ready to share a car.
Where to site them and how to size them so that they are genuinely used.
Considerable public investment: estimating real demand before committing to it.
A question of social fairness: anticipating who will be affected and what alternatives to offer.
Assessing a potential that is often poorly known and sizing the service accordingly.
Scooters, bike sharing: measuring their real effect on other modes.
Who it's for
Major projects
Cycle express networks, low-emission zones, trunk routes: our teams model your scenarios alongside your consultancy.
Everyday projects
Mobility plan, local development, new service: your teams explore the data and test their ideas on their own.
Explore the platformAbout us

Participatory mobility: what residents experience and expect.

Large-scale mobility data: flows, modal shares, origins and destinations.

A leading computer science research laboratory, specialising in machine learning.
Regional i-Démo award winner, an investment programme for the future (PIA4) under France 2030, supported by the French State, the Provence-Alpes-Côte d'Azur Region and Bpifrance.

Do you have a development project or a new service in mind? Show us your question, and we'll show you what MOBIMIX can answer.